Monitoring of Algal Blooms / Vegetation Growth in Open Water: Remote Sensing Methodology


Photo by Goulet Isabelle on Unsplash
With satellite imagery becoming more accessible and the development of user-friendly cloud platforms, it's no surprise that handling large amounts of data has become easier than ever. Taking advantage of these advancements, I recently stumbled upon an unexpected discovery while explaining the Normalized Difference Vegetation Index (NDVI) to a friend.
In this blog, I explain a technique that I developed to identify water bodies with vegetation growth.
For this technique, we will be utilizing the RED, NIR, Green, and SWIR 1 bands, which are available in both Landsat and Sentinel series satellites. In this analysis, we have opted for Sentinel-2 due to its higher spatial resolution.
| Band Number | Name | Wavelength (nm) | Resolution (m) |
| B3 | Green | 559.8 | 10 |
| B4 | Red | 664.6 | 10 |
| B8 | NIR | 832.8 | 10 |
| B11 | SWIR 1 | 1613.7 | 20 |
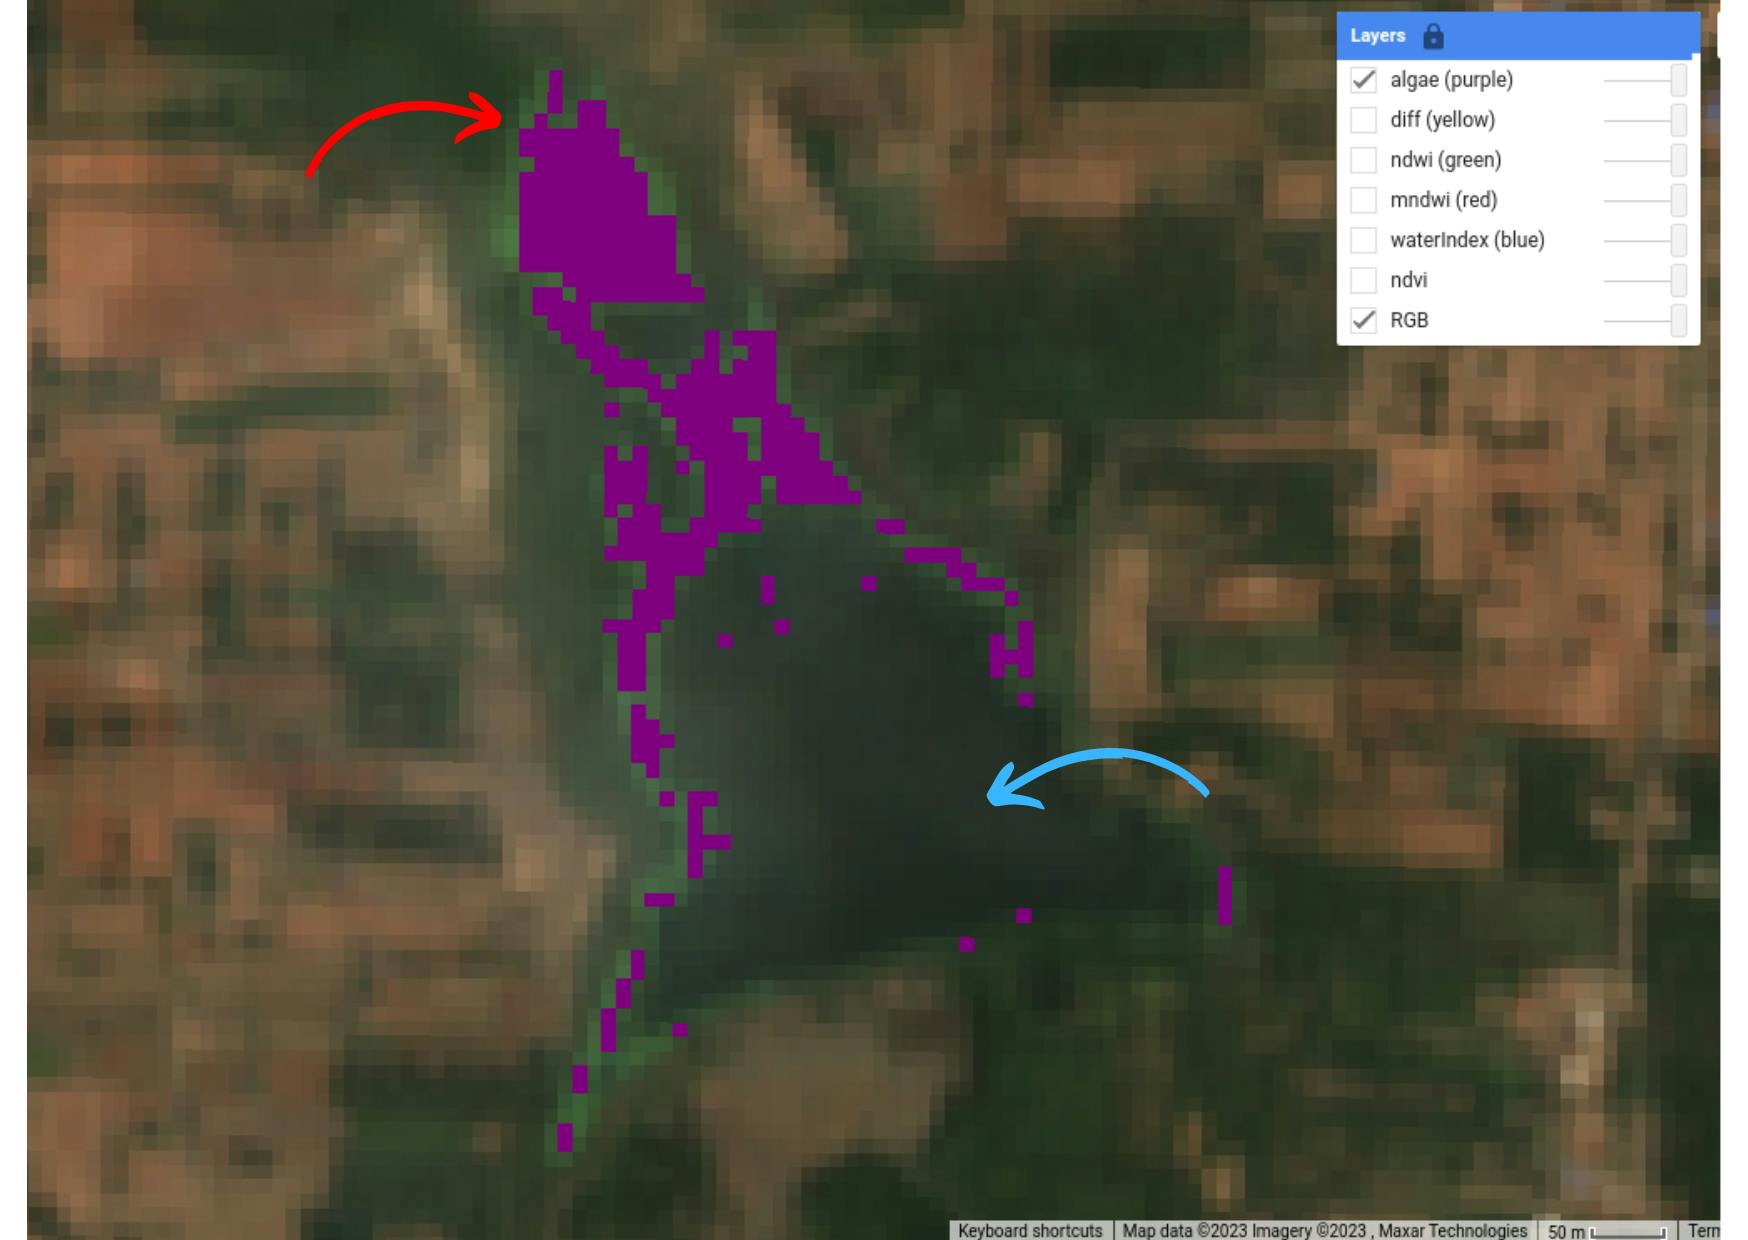
Let's us understand the reflectance of these bands in vegetation, clear water, and water with vegetation. I have chosen a lake region near Mysore which has algal growth in the edges and clear water in the center of the lake.
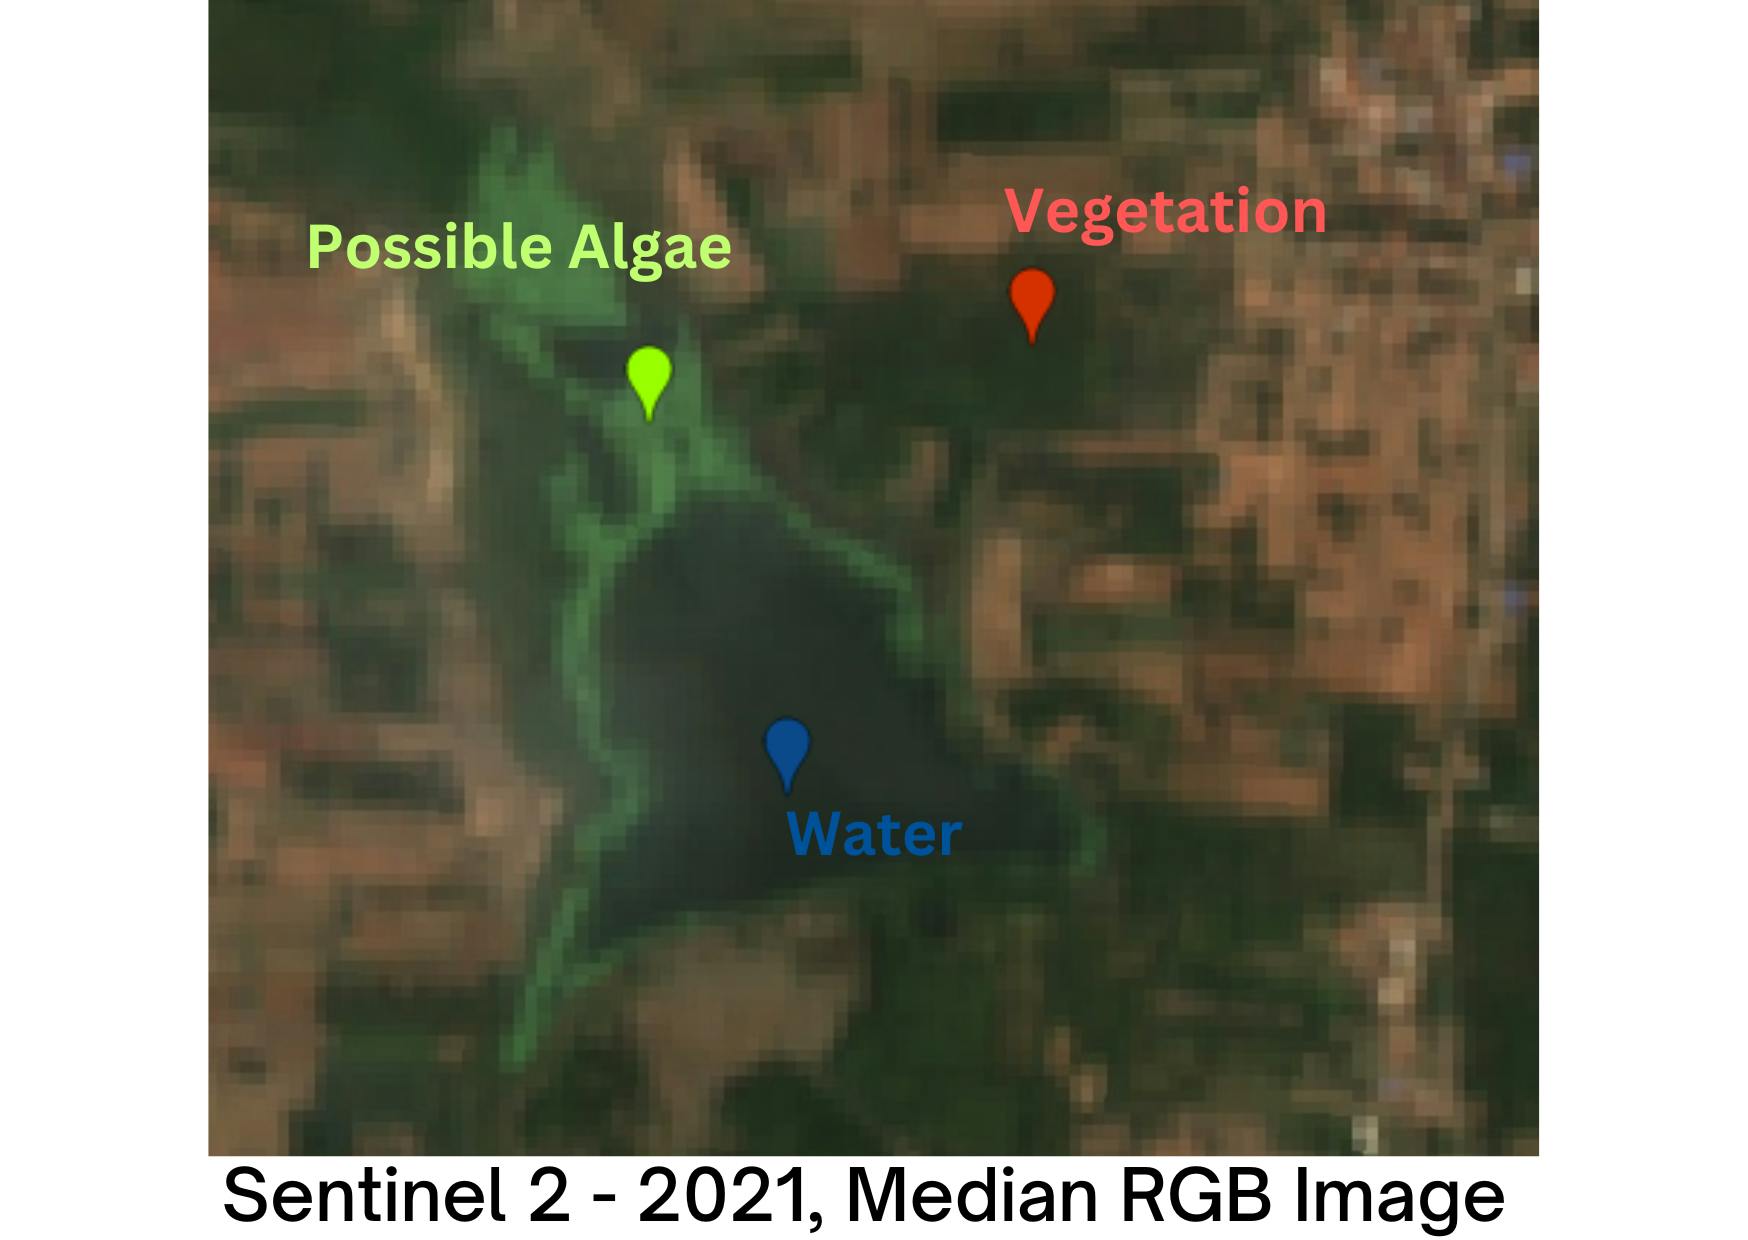
Now let's inspect the spectral difference in all three locations for all four bands.

When observing the vegetation (farm), a significant contrast between the Near Infrared (NIR) and Red bands becomes evident, which aligns with expectations. Notably, the reflectance in the green band is comparatively lower. Also, we can see in this observation that NIR > Red. So does the NDVI is the normalised difference of NIR and Red band.
In water surfaces, the considerable difference arises primarily between the Green and Shortwave Infrared 1 (SWIR1) bands, a result consistent with anticipations. In the case of water, it is expected that the reflectance in the green band will be the highest. So does the MNWDI is the normalised difference of the Green and SWIR1 band.
Upon analyzing the reflectance from algae, similarities emerge with vegetation, like a huge difference between the NIR and Red bands. Also, algae exhibit high reflectance in the green band, similar to the water region's behavior.
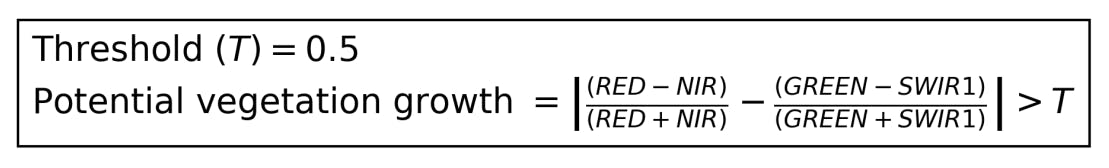
Utilizing this information, I created an image by calculating the normalized difference of the Red and NIR bands, resulting in a very low value for vegetation and a high value for regions without vegetation. I then compute the difference between MNDWI and this image. This "difference" image can be used to identify and flag vegetation growth in the water bodies.
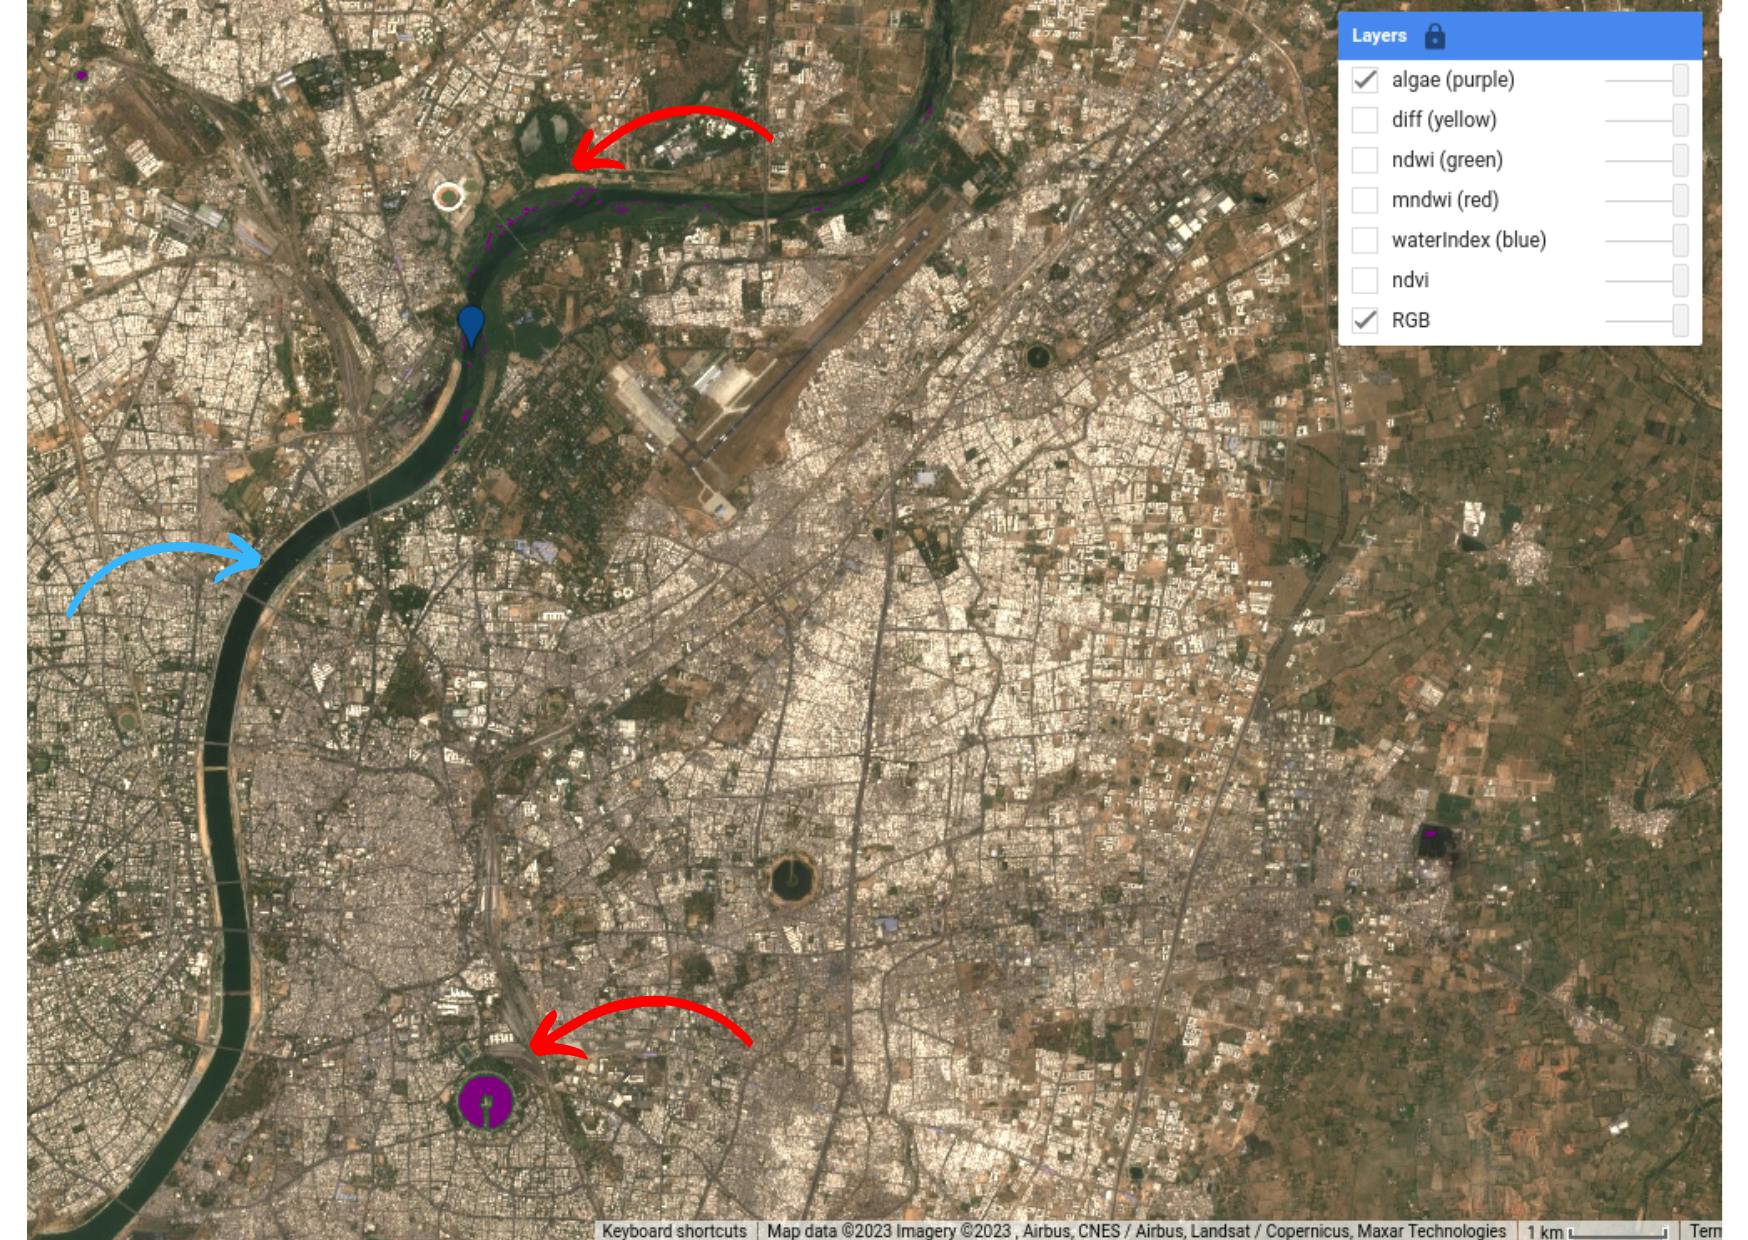
I tried to validate this in different locations, seems to have a pretty decent result.
In Ahmedabad, Kankaria Lake shows signs of vegetation growth, while the Sabarmati River remains relatively clean within the city limits. There is slight vegetation growth detected on the eastern outskirts of the city along the Sabarmati River. Due to westward flow, this vegetation growth location likely has facilities for banking and regulating river water flow inside the city.
In Mysore, a lake exhibiting vegetation growth along its edges has been accurately detected.
Earth Engine script : [code]
PS:
1. This methodology is not peer-reviewed.
2. This work and blog are still under development.