


Satellite-based Precipitation Products are critical for weather monitoring, natural hazard forecasting, and water resource management. The accuracy of such products is vital for any action. Apart from accuracy, these products' latency is also essential as high precision data with huge latency may not be helpful in real-time management during hazards.
Here I have compared the CHIRPS Pentad vs. GPM.
Data
1. CHIRPS Pentad
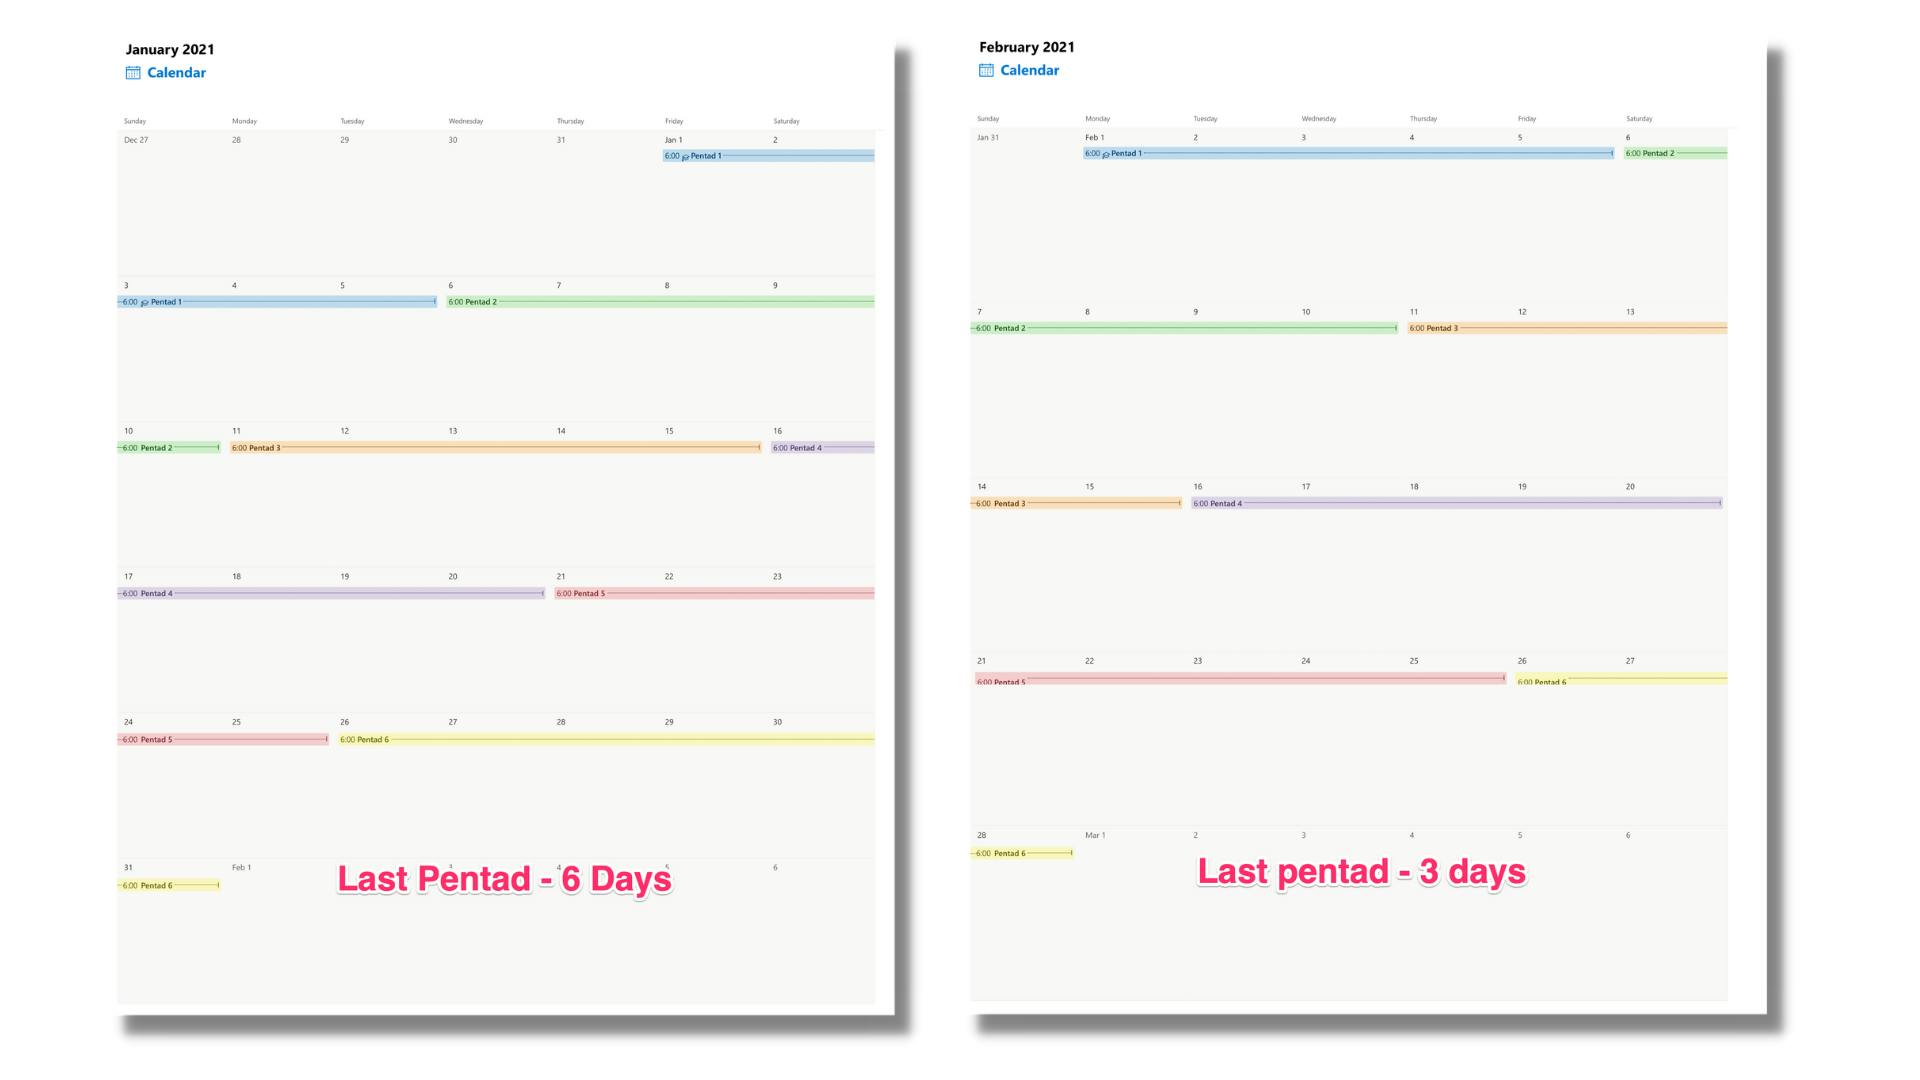
Climate Hazards Group InfraRed Precipitation with Station (CHIRPS) data is global gridded rainfall dataset. This data is available from 1981 Jan. The spatial resolution of the data is 0.05° (~6km), and coverage is from +50° to -50°. Hence the region outside this latitude cannot be beneficial from this data. It has a unique temporal format called pentad. Each month will contain six pentad cycles, every month will have the first pentad starting from day 01 of the month, where a pentad duration is five days, but the final pentad of the month can contain 3-6 days depending on the number of days in the month. The final product has an average latency of about three weeks.
Note: CHIRPS daily data is available, but it is derived by disaggregating pentad product. Hence it is not recommended to use unless necessary.
2. GPM
Global Precipitation Measurement (GPM) is launched by the National Aeronautics and Space Administration (NASA) and Japan Aerospace Exploration Agency (JAXA). It uses the dual-frequency precipitation radar and a multi-channel GPM microwave imager. It has a lower spatial resolution of 0.1° (~12km) when compared to CHIRPS. But has more excellent coverage between +65° to -65° Latitude. There are two products in GPM
- IMERG
- GSMaP
For this blog, I have considered IMERG. It has a latency of 6-hours, and the data record is for every 30-min.
Comparison
Lets us check the GPM IMERG data against the CHIRPS Pentad. So we need to convert the 30-min data into Pentad format.
To implement this, we can make multiple conditions statements depending on the number of days in the month (28, 29, 30 & 31 days). Then consider the leap and non-leap year and so on. But this clearly will hinder the parallel processing architecture. Refer to the Coding Best Practice guide to understand why to avoid conditional statements in GEE.
But when you look into the pentad formation, you can notice the first five pentads will have the same dates irrespective of the month, and the last pentad will always start on a particular date and end on the final day of the month.
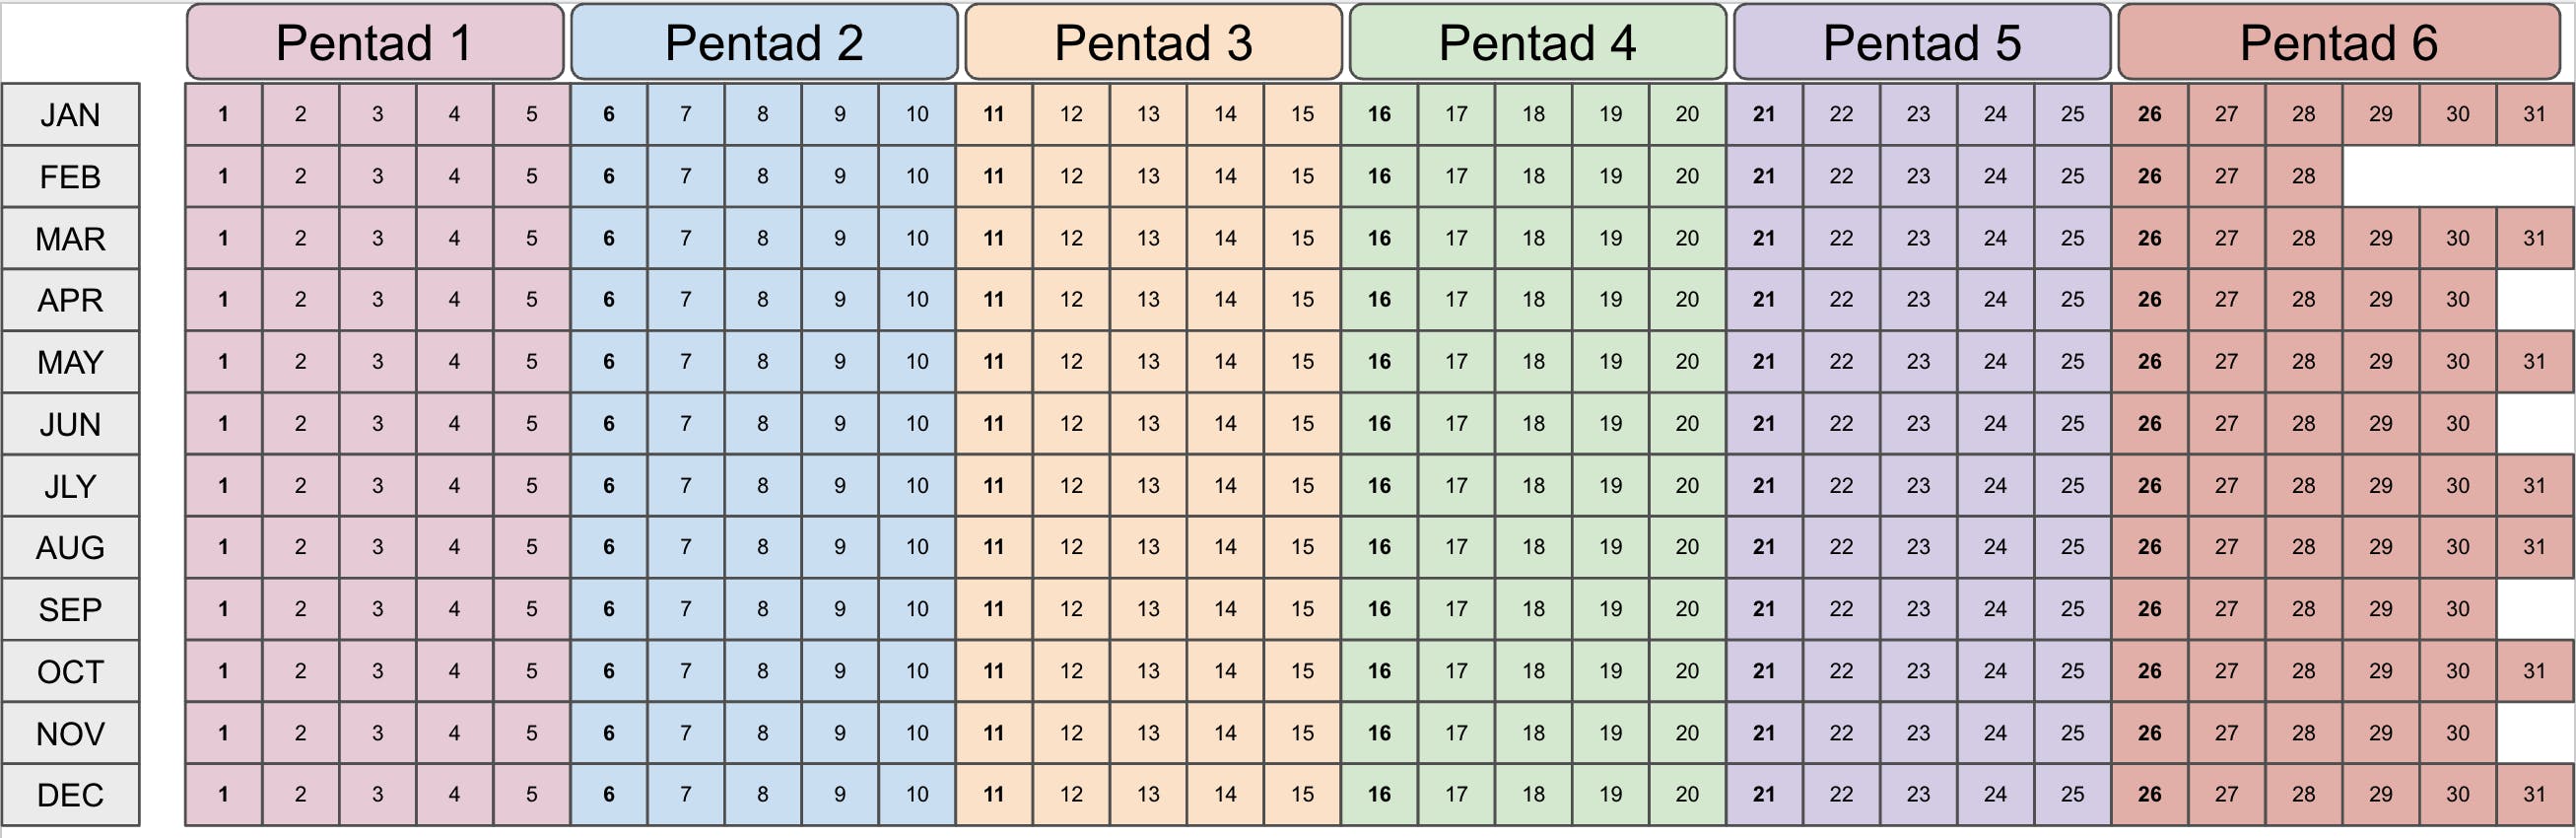
Using this pattern and Date operations in the earth engine, we can develop a much simpler logic to create the pentad formation.
function getPentadFormat (monthStartDate){
    // Cast date
    var monthStartDate = ee.Date(monthStartDate)

    // Create the end date. Since GEE will not consider the end date,
    // to give 31-Mar as end date 01-Apr should be given.
    var monthEndDate = monthStartDate.advance(1, 'month')

    // Define Pentad start pattern
    var pentadSequence = ee.List.sequence(0,20,5)

    // Create regular pentad
    var regularPentad = pentadSequence.map(function(x){
          var start = monthStartDate.advance(x, 'day')
          var end = start.advance(5, 'day')
          return ee.List([start, end])
    })

    // Create last pentad usign the month end date.
    var lastPentadStart = monthStartDate.advance(25, 'day')

    var lastPentad = ee.List([lastPentadStart, monthEndDate])

    var pentadDateList = regularPentad.add(lastPentad)

    // Convert it as FC and return.
    var pentadDateFC = pentadDateList.map(function(p){
          var dateStart = ee.Date(ee.List(p).get(0))
          var dateEnd = ee.Date(ee.List(p).get(1))
          var days = dateEnd.difference(dateStart, 'day')

          // The index start at 0, so add 1 to get the pentad number.
          var pentadNumber = ee.Number(pentadDateList.indexOf(p).add(1)).format('%d')
          var yearMonth = dateStart.format('yy-MMM')
          var pentadCount = yearMonth.cat('-P').cat(pentadNumber)
          return ee.Feature(null, {'system:time_start':dateStart.millis(),
                                   'system:time_end':dateEnd.millis(),
                                   'startDate':dateStart.format('yyyy-MM-dd'),
                                   'endDate':dateEnd.advance(-1, 'day').format('yyyy-MM-dd'),
                                   'totalDays':days,
                                   'pentad':pentadCount
          })

    })

    return pentadDateFC

}
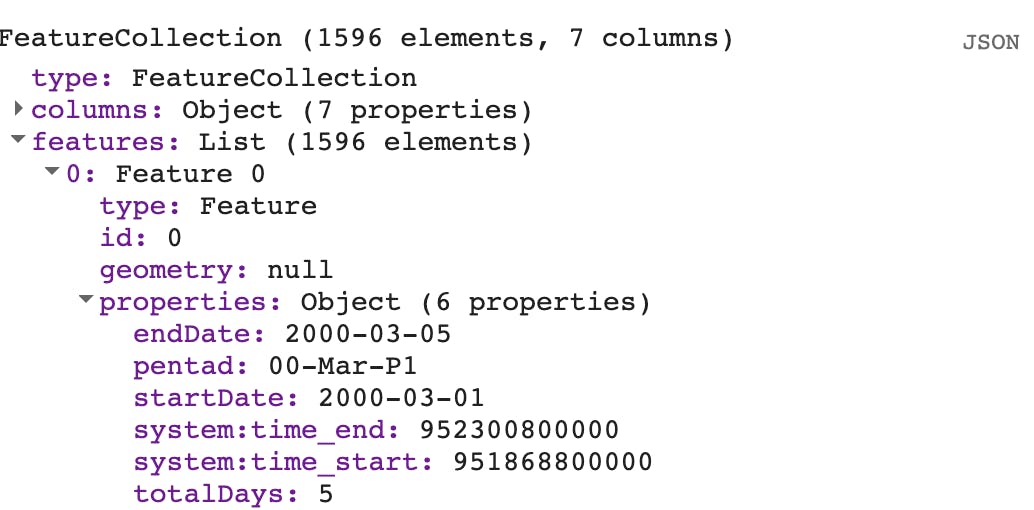
The pentad data are obtained as FeatureCollection, and each feature will contain the pentad startdate and enddate. The earth engine uses the system:time_start/end property as a de facto time parameter in any time series formation or filter statement. Also, while filtering to a particular date range, the enddate is exclusive. (i.e.) to filter from 01-Mar to 31-Mar date range should be given as 01-Mar to 01-Apr. Hence the system:time_end is calculated keeping this in mind.
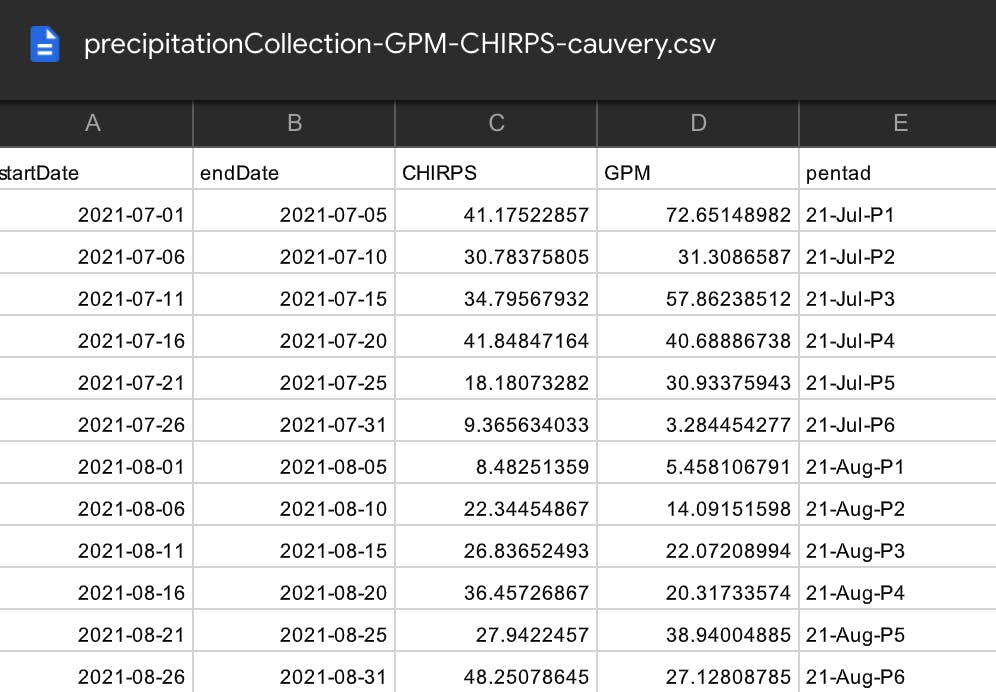
After creating the pentad time ranges, the GPM and CHIRPS data are filtered to each pentad, and the stats over a hydroShed basin is computed to obtain the mean precipitation in that location.
var precipitationCollection = reqPentad.map(function(feature){
  var sDate = ee.Date(feature.get('system:time_start'))
  var eDate = ee.Date(feature.get('system:time_end'))

  {
    // GPM Precipitation
  var collectionGPM = gpm.select('precipitationCal');

  var imageGPM = collectionGPM.filter(ee.Filter.date(sDate, eDate))
                        .map(convertUnit)
                        .sum()

  var statGPM = imageGPM.reduceRegion({
    reducer:ee.Reducer.mean(),
    geometry:geometry,
    scale:11132,
    maxPixels:1e16,
    tileScale:16})

  var precipitationGPM = statGPM.get('precipitationCal')
  }

  {
    //CHIRPS Precipitation

  var chirpsImage = chirps.filter(ee.Filter.date(sDate, eDate)).first()
  var statCHIRPS = chirpsImage.reduceRegion({
    reducer:ee.Reducer.mean(),
    geometry:geometry,
    scale:5566,
    maxPixels:1e16,
    tileScale:16})

  var precipitationCHIRPS = statCHIRPS.get('precipitation')
  }

  return feature.set({'GPM':precipitationGPM, 'CHIRPS':precipitationCHIRPS})
})
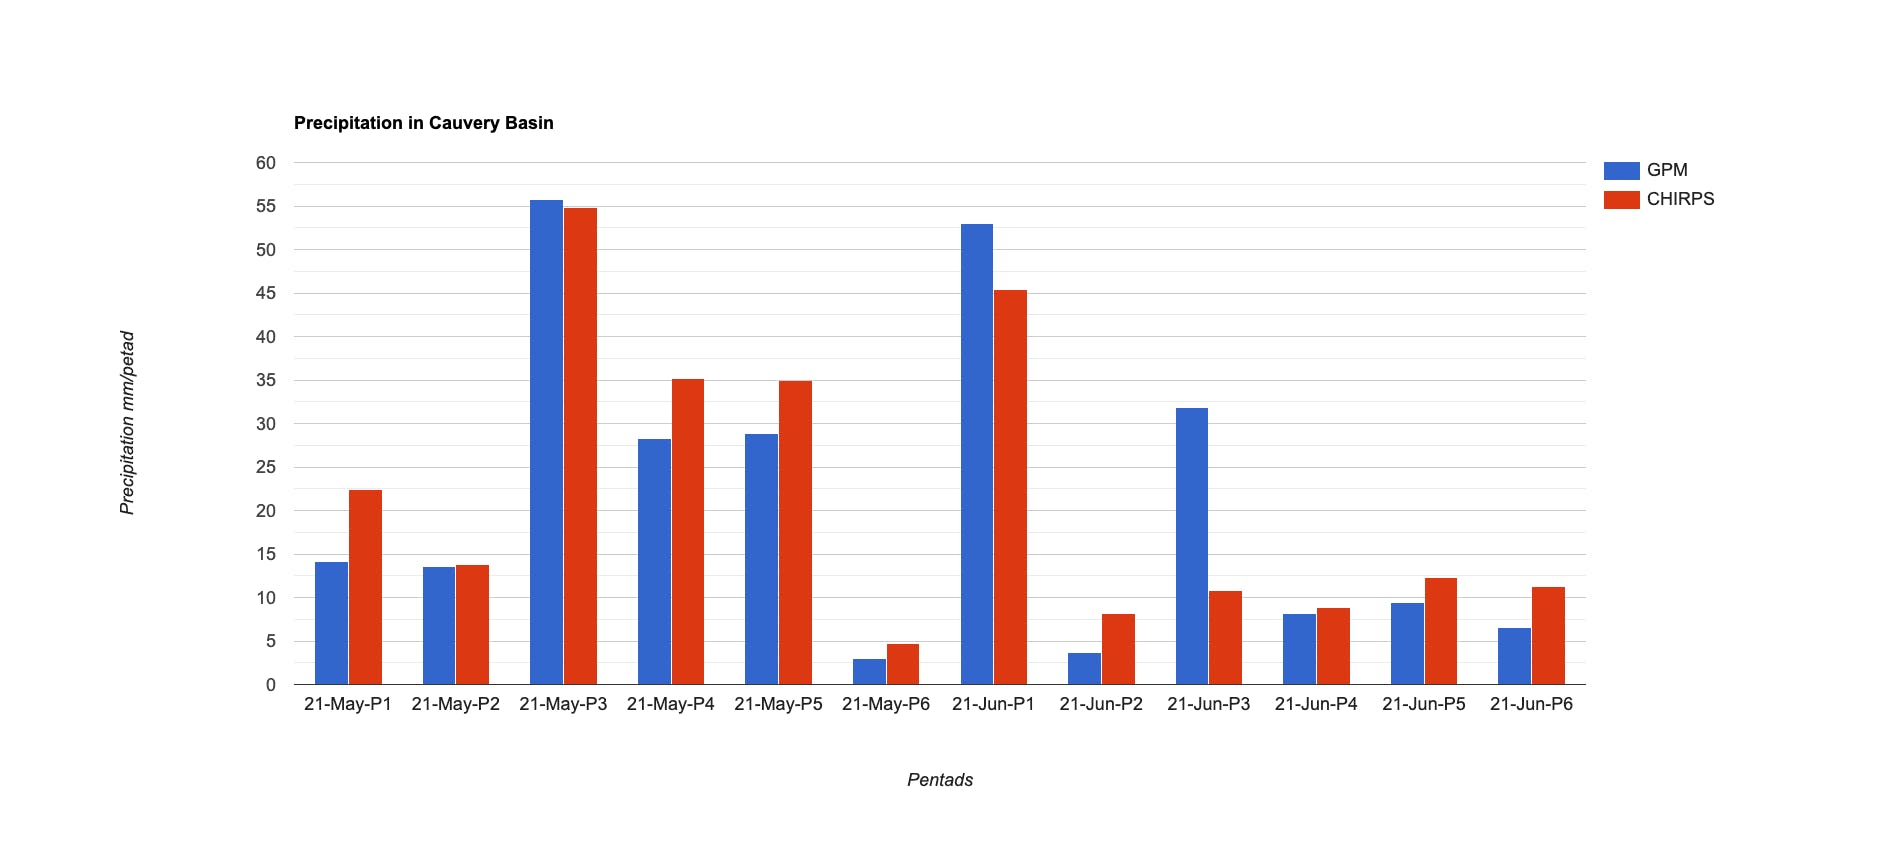
Now, we can plot the precipitation values of GPM and CHIRPS to compare the values from both data products.
var plot = ui.Chart.feature.byFeature({
  features:precipitationCollection,
  xProperty:'pentad',
  yProperties:['GPM', 'CHIRPS']}).setChartType('ColumnChart').setOptions({
    'title':'Precipitation in Cauvery Basin',
    'vAxis': {title: 'Precipitation mm/petad'},
    'hAxis': {title: 'Pentads'}
  })
We can also export these values as a CSV file.
Code to execute above operation can be accessed here : open code editor
Disclaimer : This is not a scientific approach. A ground truth data can be used as a parameter to validate against both SPP. This blog aims to emphasis the computation using date functions and .map() in earth-engine.