


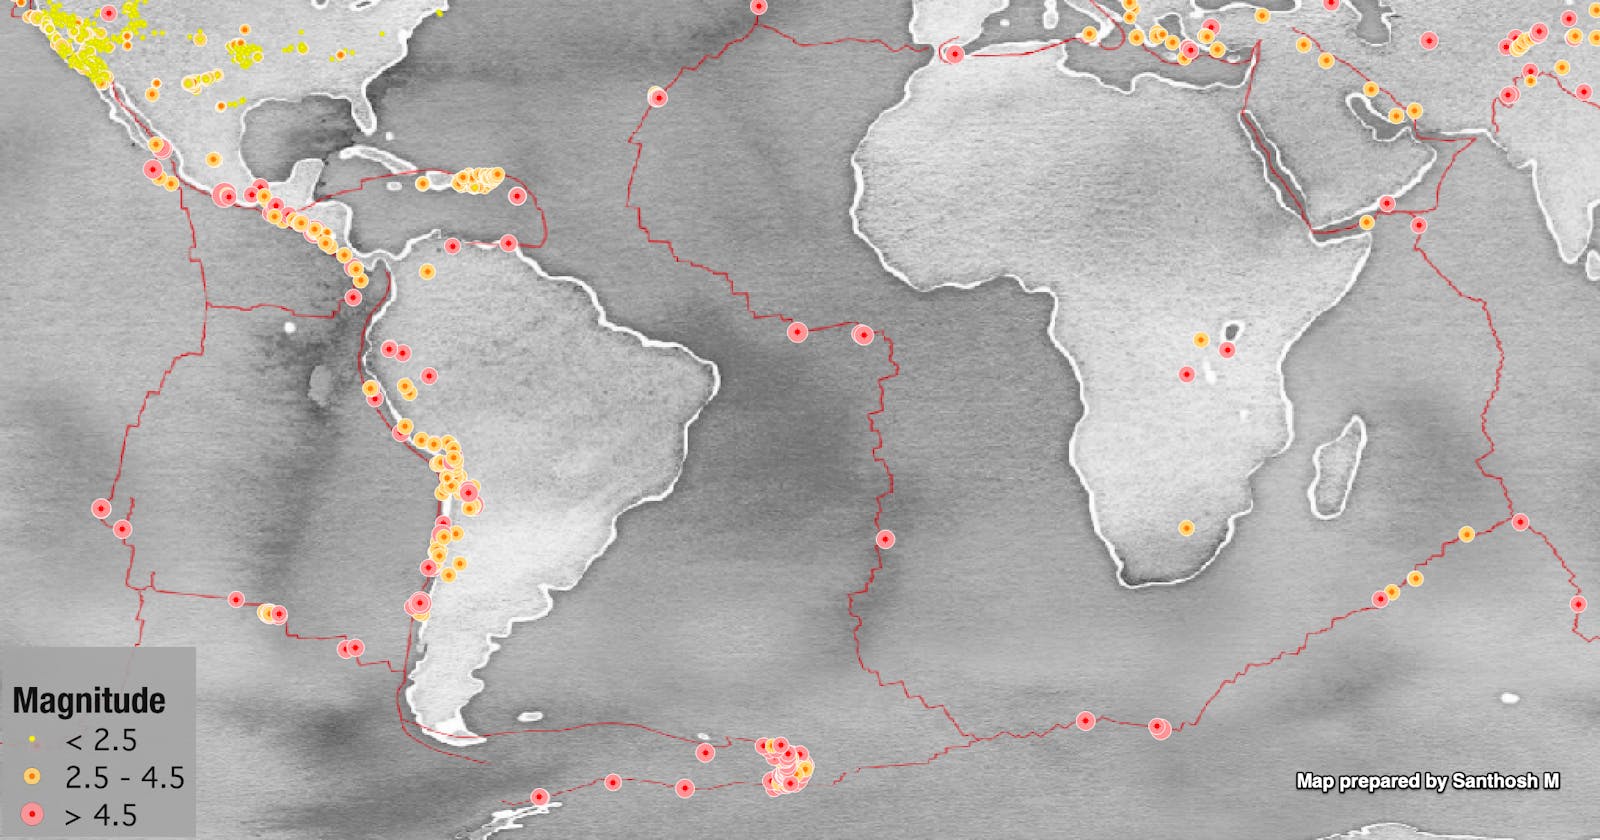
National Earthquake Information Center (NEIC) a part of United States Geological Survey (USGS), monitors earthquake across the globe and record their the location and size. This seismic activity database is available to the public for research and educational purposes. Users can access this data via API and get the data in different formats such as CSV, GeoJSON, KML, etc...
This blog shows,
- How to use the USGS API key in python to get the seismic data.
- Understand GeoJson format.
- Export the data as a GeoPackage and visualize it in QGIS.
Get the seismic data from USGS
USGS records the seismic activity worldwide and makes the data public, we can access this data from earthquake.usgs.gov. We can also get data for Past Hour, Past Day, Past 7 Days, and Past 30 Days. As this real-time data gets updated every minute, using API to get data is more efficient if we need to periodically get data for analysis. After writing a python script we use CronJob/windows Scheduler to run the programm and get a spatial data layer without any manual interventions.
Now Dr. Lawrence Hayes, can get seismic activity data for every hour as spatial layer without any manual work.
Movie scene from San Andreas
Let's code.
The python modules are a reusable block of code that we can install and use in our script. The following modules are used for this project.
os module is used to join paths of directories and file names. So we don't have to be worry about which operating system this code runs. IT does the right thing for us.
requests module is used to fetch a particular URL value, and here it is the USGS seismic activity data.
json module is used to read and convert the request returned object to a JSON format.
time module is used to get the current time as we intend to run a cronJob finally, name files. More importantly, it is used to convert the seismic activity occurrence time to a human-readable format.
geopandas module is the spatial version of the popular pandas library. We can create GeoDataFrame, read and writes vector layers. By convention it is imported as gpd
time, geopandas many not be available in the with default installation. I found Anaconda to be very helpfull in resolving package dependency issues for installing. Thankyou Anaconda ! :)
import os
import json
import time
import requests
import geopandas as gpd
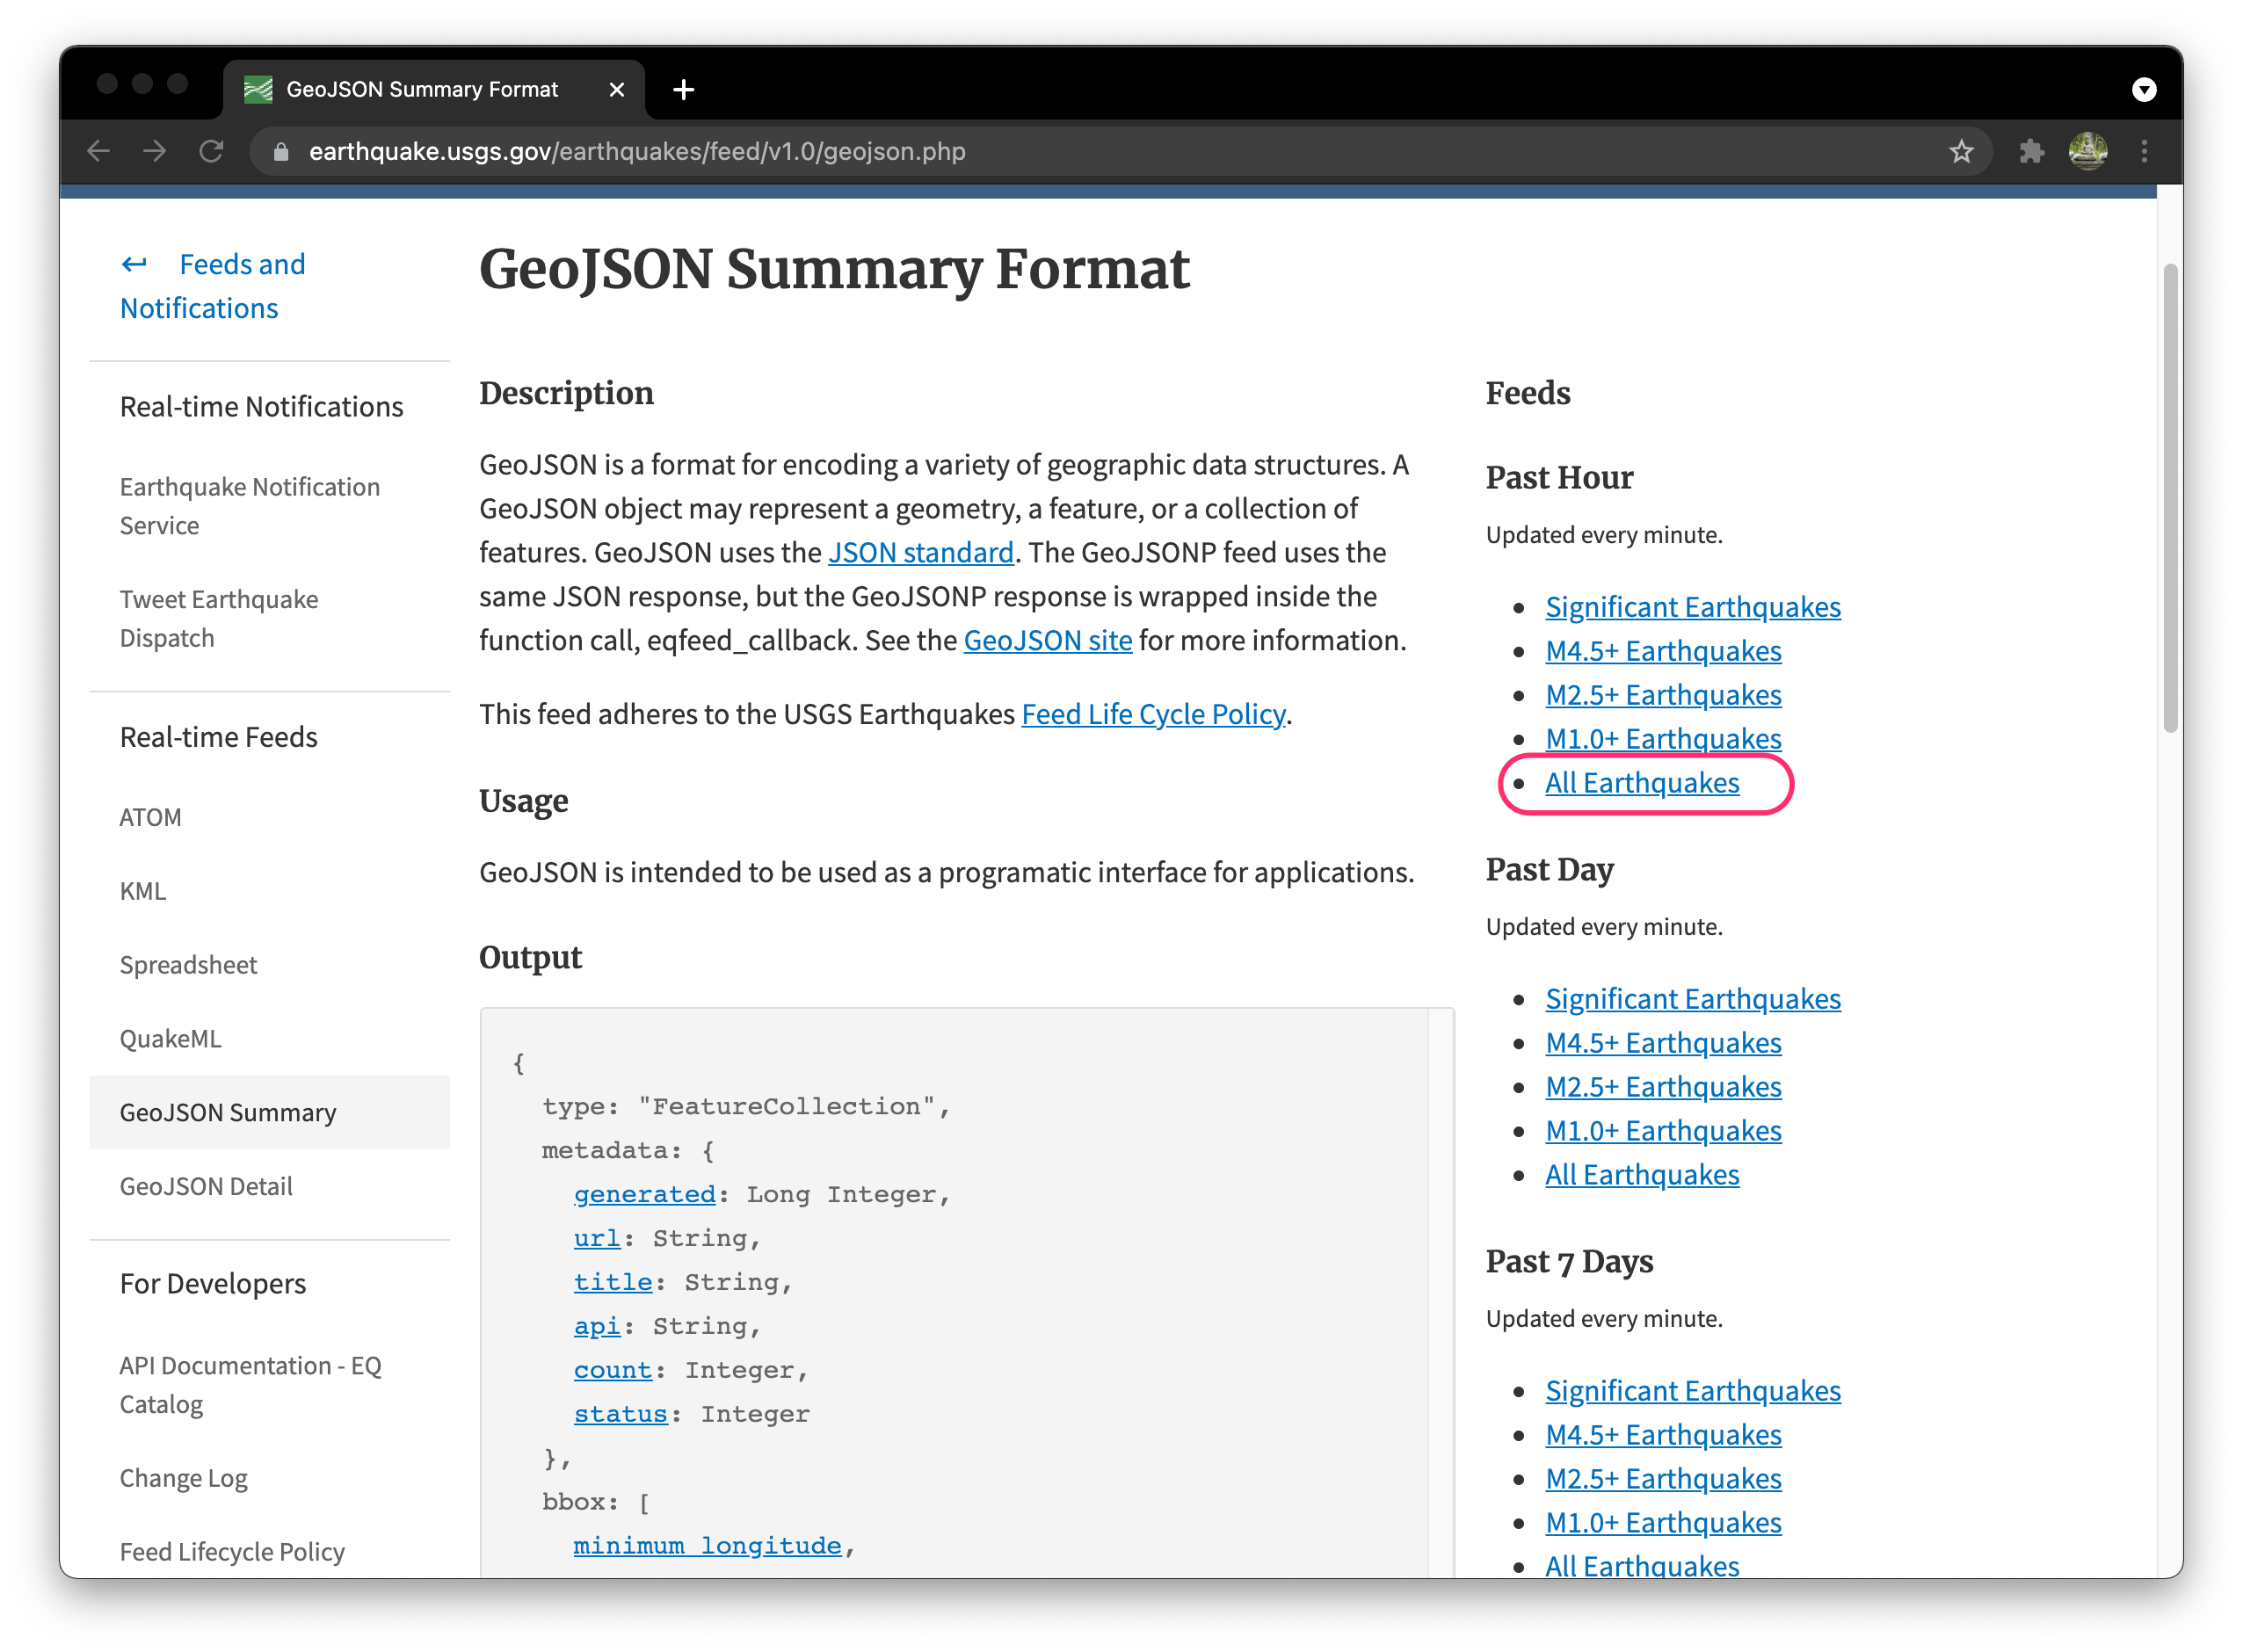
Visit earthquake.usgs.gov webpage to get the GeoJSON Summary API URL. Here you can select a different format like KML is ready to use vector file, we can load it in Google Earth for 3D visualizations. USGS already styles this KML file. But for this project, let us stick to GeoJSON Summary. It will return us a text file with all details in a structured format.
API - Application program interface allows us to communicate with a remote system or software and fetch information. Surprisingly, amongst the most popular APIs, two are related to the geospatial world. Google Maps and Accuweather. Using the .get() method in the requests module lets us interact with USGS and query our required data. Since the API is in a particular structure, we don't have to worry about the operation of OS.
response =requests.get('https://earthquake.usgs.gov/earthquakes/feed/v1.0/summary/all_hour.geojson')
The defacto output format for any request call is JSON. When we add spatial attributes such as geometry -> type, and coordinates, it is called GeoJSON. These formats are human-readable, and data abstraction can be quickly done in python using index and keys.
response = response.json()
response['features'][0]
# Displaying first feature from the GeoJSON data.
{'type': 'Feature',
 'properties': {'mag': 1.8,
  'place': '30 km SW of Skwentna, Alaska',
  'time': 1632888597630,
  'updated': 1632888797590,
  'tz': None,
  'url': 'https://earthquake.usgs.gov/earthquakes/eventpage/ak021chwm6mr',
  'detail': 'https://earthquake.usgs.gov/earthquakes/feed/v1.0/detail/ak021chwm6mr.geojson',
  'felt': None,
  'cdi': None,
  'mmi': None,
  'alert': None,
  'status': 'automatic',
  'tsunami': 0,
  'sig': 50,
  'net': 'ak',
  'code': '021chwm6mr',
  'ids': ',ak021chwm6mr,',
  'sources': ',ak,',
  'types': ',origin,',
  'nst': None,
  'dmin': None,
  'rms': 0.69,
  'gap': None,
  'magType': 'ml',
  'type': 'earthquake',
  'title': 'M 1.8 - 30 km SW of Skwentna, Alaska'},
 'geometry': {'type': 'Point', 'coordinates': [-151.807, 61.7972, 99.3]},
 'id': 'ak021chwm6mr'}
GeoPandas has changed the way spatial data works with python, as it is built on the powerful module pandas. The operations are very similar to the pandas module.
Let's create an empty GeoDataFrame and add each earthquake record to it.
exportDf = gpd.GeoDataFrame()
This loop will create a new DataFrame for every feature and store only the magnitude, place, time, alerts, tsunami status, and geometry. We keep all records as point features with their latitude and longitude information. Since it is all GPS coordinates, the CRS is EPSG:4326. The time give by USGS is in milliseconds. So we can convert that to Epoch time by dividing it by 1000 and convert to a human understandable format.
for i, data in enumerate(response['features']):
    gdf = gpd.GeoDataFrame()
    coord = data['geometry']['coordinates']
    geometry = gpd.points_from_xy([coord[0]], [coord[1]])
    gdf = gpd.GeoDataFrame(data['properties'], index = [i], geometry = geometry, crs='EPSG:4326')
    gdf = gdf[['mag', 'place', 'time', 'alert','status','tsunami', 'geometry']]
    gdf['time'] = time.strftime('%Y-%m-%d', time.gmtime(gdf['time'][i]/1000))
    exportDf = exportDf.append(gdf)
Since the master GeoDataFrame has no CRS defined lets define the CRS for it.
if exportDf.crs == None:
    exportDf.set_crs('epsg:4326', inplace=True)
During the export, we can save it in a particular directory. Also, since we are getting data every hour, it will be a mess if a new GeoPackage is generated every time, so by creating a one GeoPackage for one day and we can store every hour data in it as a single layer.
For 30th September 2021 filename will be 20210930, and the layer name will be 00_13, 01_12, 02_06 .... 24_10. The number after hour indicator is the total number of earthquake happened in that hour.
directory = 'earthquakes'
name = strftime("%Y%m%d", time.localtime())
filename = os.path.join(directory, name + '.gpkg')
layername = "_".join([strftime("%H", time.localtime()), str(len(response['features']))])

exportDf.to_file(driver='GPKG',
                 filename=filename,
                 layer=layername,
                 encoding='utf-8')
print(f'Export {name} {layername} sucessfull')
Download notebook
Read my next blog for setting up cronJob and filtring to a particular region using spatial join.
Happy Learning :)